Child Poverty in London
The Campaign to End Child Poverty has today published new figures showing that London contains 14 out of the top 20 local authorities with the highest rates of child poverty across the UK.
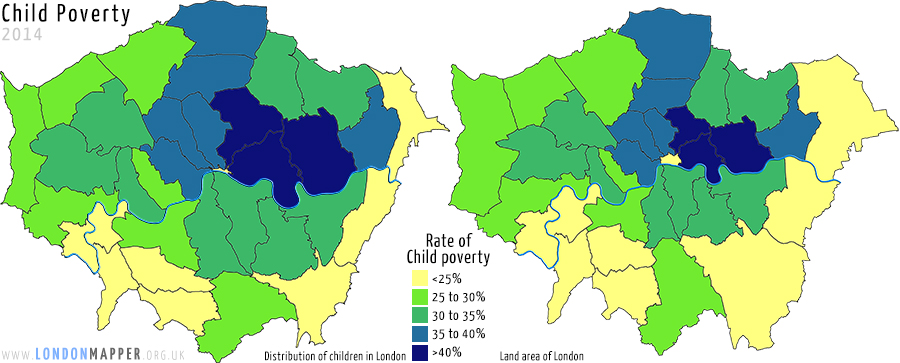
The above maps compiled from their data show the percentage of children in poverty (after housing costs) displayed on a cartogram projection of all children living in London (left), where each borough is resized according to the total number of children living there, and on a conventional land area map (right).
Tower Hamlets is the London borough with the highest rate at (49%) and Richmond upon Thames the lowest (15%). In fifteen of the 33 London boroughs between one third and a half of children are poor.
Half of the top 20 UK parliamentary constituencies with the highest child poverty rates are in London. Bethnal Green and Bow which has 49% children in poverty is the highest in London and the lowest are Wimbledon, Twickenham and Richmond Park which each have 15% .
The London local authorities with the highest levels of child poverty are:
- Tower Hamlets 49%
- Hackney 41%
- Newham 41%
- Westminster 39%
- Islington 38%
The local authorities with the lowest rate of child poverty in London are:
- Bromley 21%
- Kingston upon Thames 21%
- Sutton 20%
- City of London 16%
- Richmond upon Thames 15%
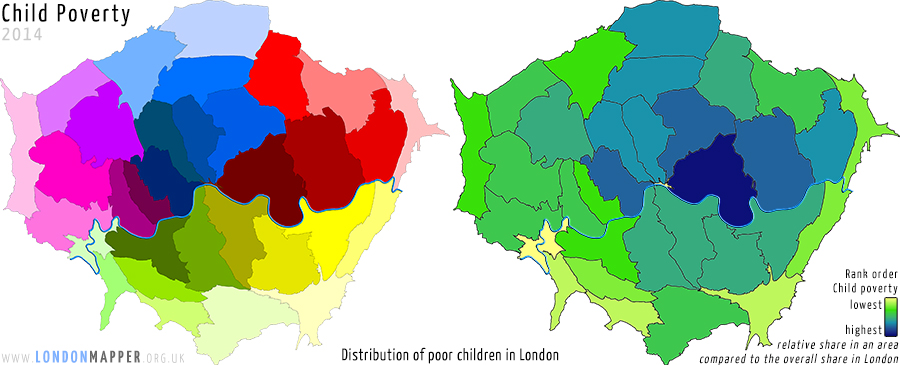
The following maps show the boroughs of London resized according to the total number of poor children living there. A reference map for the colours on the left can be found here. The rank map on the right has the same shapes, but visualises how child poverty is distributed in relation to relative shares across the city. The colours show the areas ordered by their particular rate of child poverty, going from yellow for the lowest rate of child poverty via green to blue for the highest rate of child poverty.
The data was compiled by the Centre for Research in Social Policy at Loughborough University for the Campaign to End Child Poverty.
Links
![]() Download: High-Resolution Maps (ZIP archive, 3MB)
Download: High-Resolution Maps (ZIP archive, 3MB)
![]() Further information: End Child Poverty (external website)
Further information: End Child Poverty (external website)
Related data
London boroughs: percentage of children in poverty (after housing costs)
|
Barking and Dagenham |
37% |
|
Barnet |
27% |
|
Bexley |
23% |
|
Brent |
35% |
|
Bromley |
21% |
|
Camden |
36% |
|
City of London |
16% |
|
Croydon |
30% |
|
Ealing |
31% |
|
Enfield |
37% |
|
Greenwich |
33% |
|
Hackney |
41% |
|
Hammersmith and Fulham |
31% |
|
Haringey |
36% |
|
Harrow |
29% |
|
Havering |
23% |
|
Hillingdon |
28% |
|
Hounslow |
30% |
|
Islington |
38% |
|
Kensington and Chelsea |
28% |
|
Kingston upon Thames |
21% |
|
Lambeth |
34% |
|
Lewisham |
34% |
|
Merton |
25% |
|
Newham |
41% |
|
Redbridge |
31% |
|
Richmond upon Thames |
15% |
|
Southwark |
34% |
|
Sutton |
20% |
|
Tower Hamlets |
49% |
|
Waltham Forest |
35% |
|
Wandsworth |
27% |
|
Westminster |
39% |