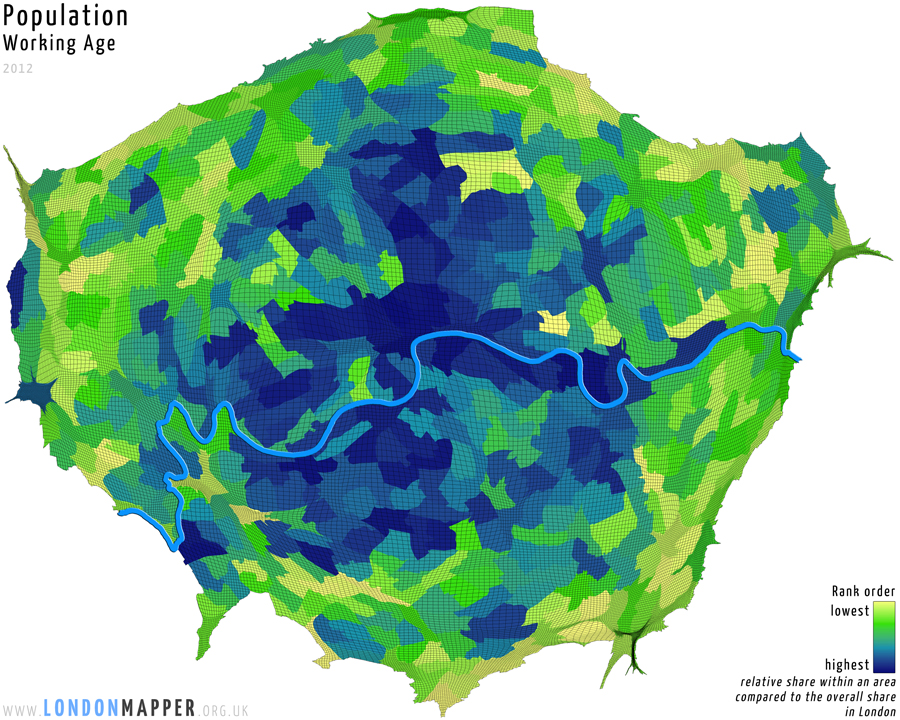
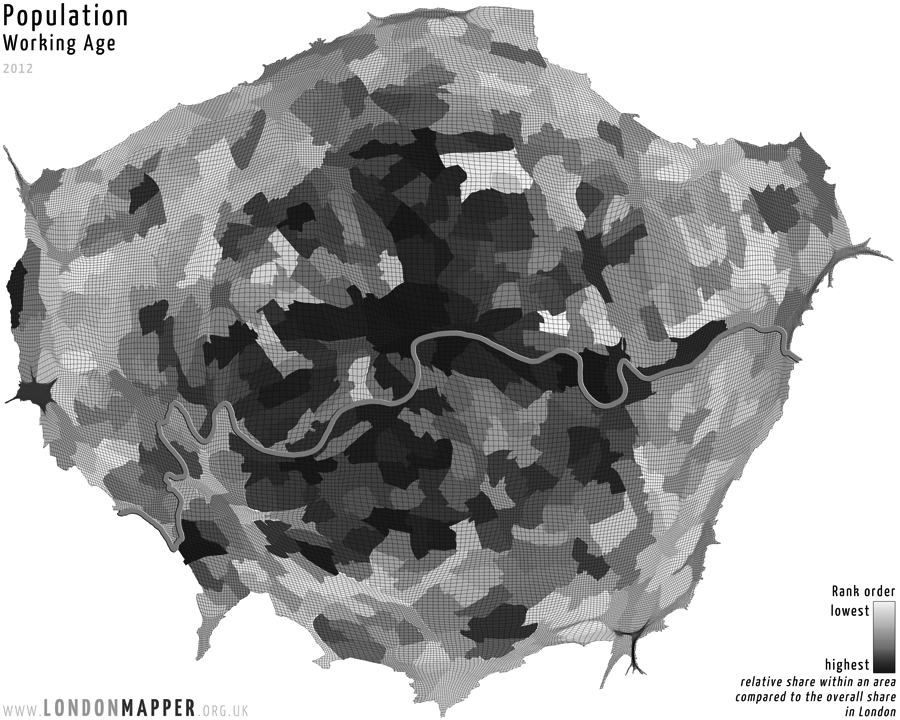
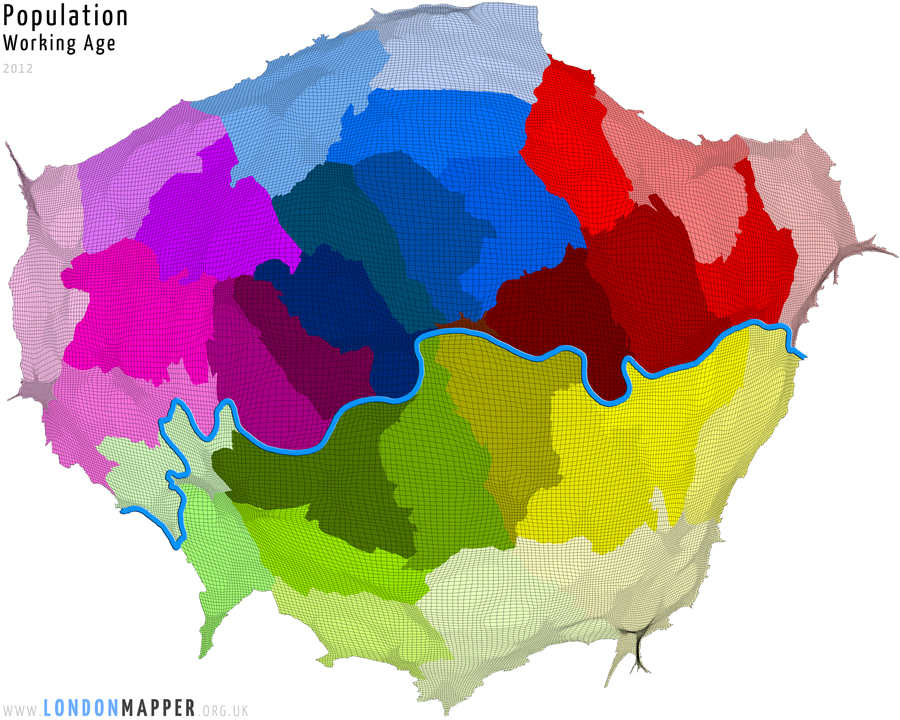
Grid Working Age Population Rank 2012
[colored]Working Age Rank Order[/colored]
[dropcap1][colored]T[/colored][/dropcap1]his map shows the area of London resized according to the total working age population (age 16 to 64) living in each of the grid cells as estimated for 2012. The rank colours show the areas ordered by the number of working age population in an area as a share of all people in that area (going from yellow for the lowest via green to blue for the highest shares).
[h5]Go To Main Topics[/h5]