Ward Incapacity Benefits Claimants 2008
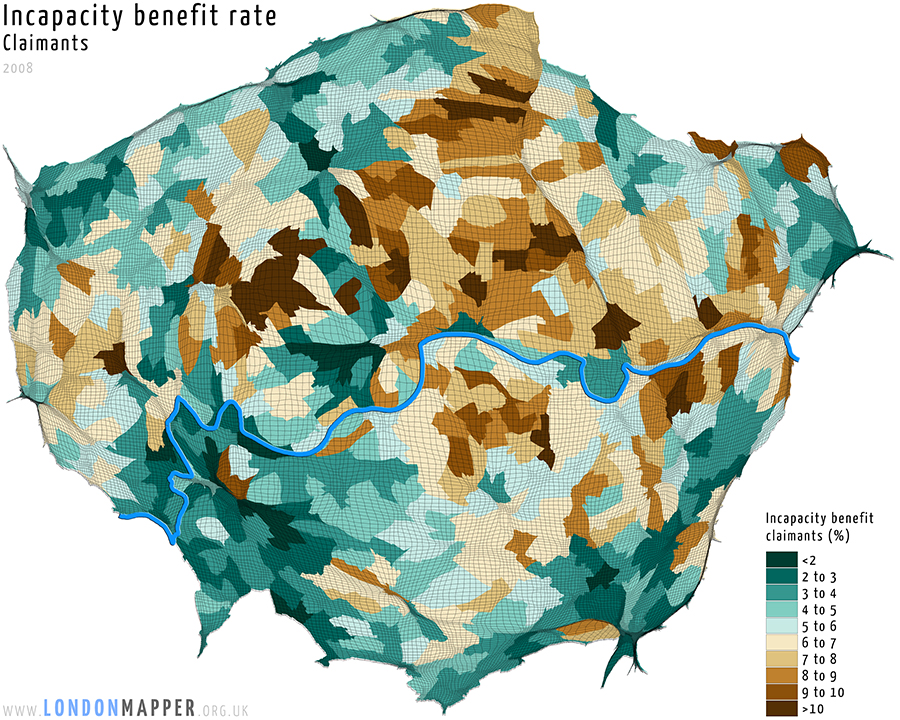
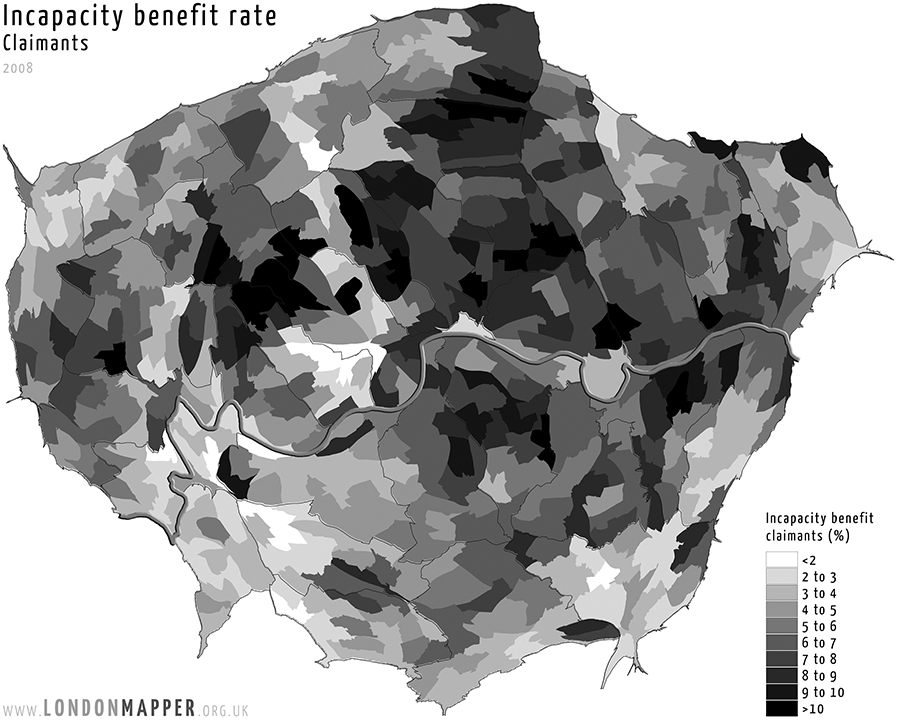
[colored]Claimant Rate of Incapacity Benefits[/colored]
[dropcap1][colored]T[/colored][/dropcap1]his map shows the area of London resized according to the total number people living in each of the grid cells as recorded in the 2011 Census. Overlaid on the basemap is the claimant rate of incapacity benefits in 2008.
See also:
Ward Incapacity Benefits Claimants 2007
Ward Incapacity Benefits Claimants 2008
Ward Incapacity Benefits Claimants 2009
Ward Incapacity Benefits Claimants 2010
Ward Incapacity Benefits Claimants 2011

[h5]Go To Main Topics[/h5]