Grid IMD Employment Scale Rank 2010

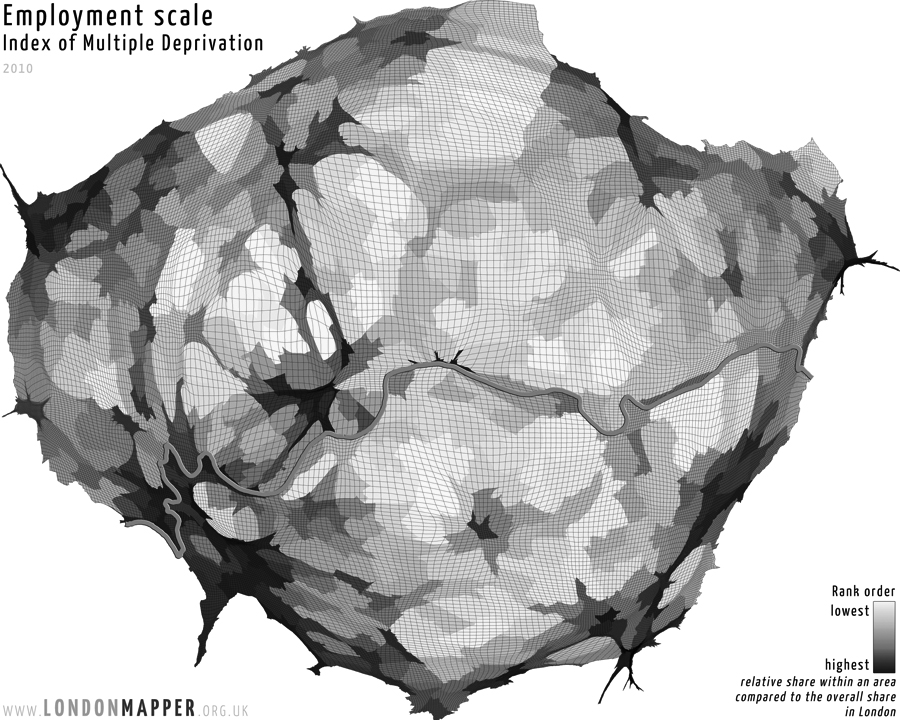
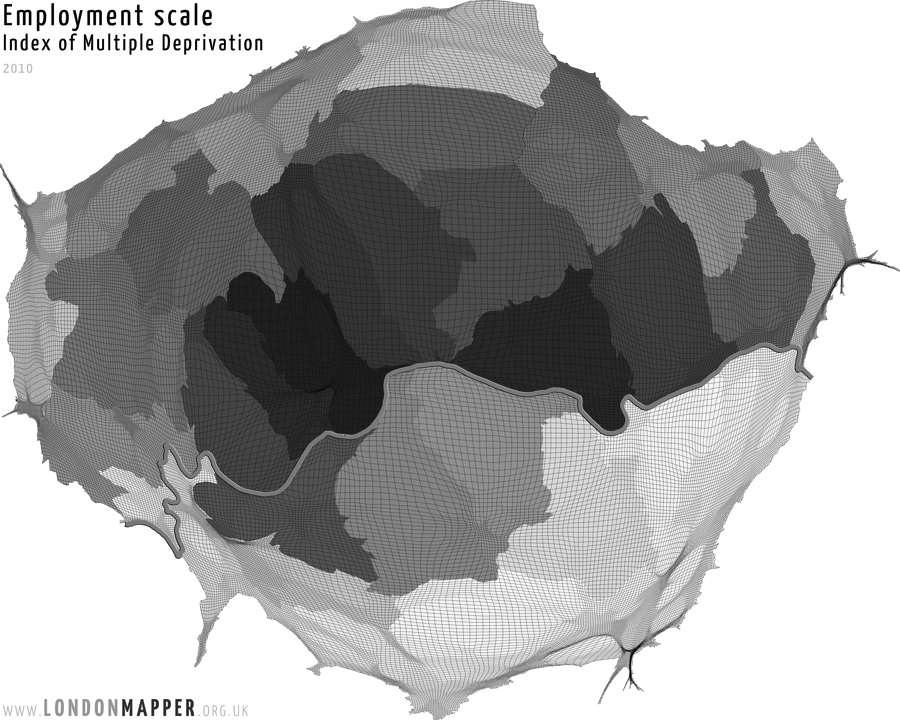
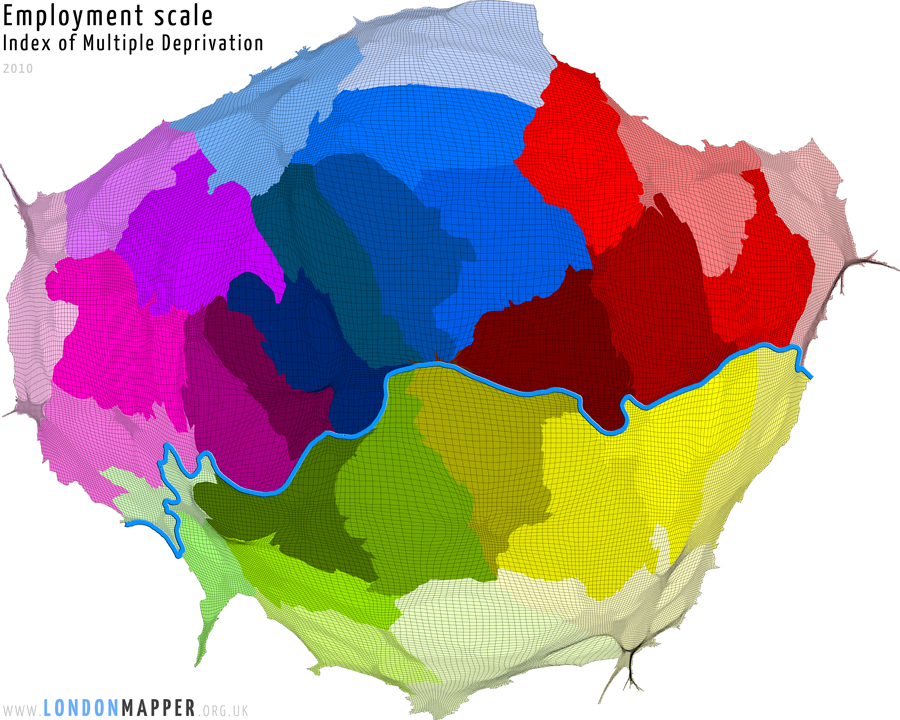
[colored]IMD Employment Scale Rank[/colored]
[dropcap1][colored]T[/colored][/dropcap1]his map shows the area of London resized according to the Index of Multiple Deprivation (IMD) Employment Scale score for 2010 multiplied by the population in each of the grid cells shown in the map. The rank colours show the areas ordered by the IMD Employment Scale score in each aera (ranked across the city from yellow for the lowest via green to blue for the highest score values).
See also:
Grid IMD Employment Scale Rank 2007
Grid IMD Employment Scale Rank 2010
Grid IMD Employment Scale Increase Rank 2007-2010
Grid IMD Employment Scale Decline Rank 2007-2010
[h5]Go To Main Topics[/h5]