Education
Teachers’ guide to Londonmapper

Londonmapper: exploring a World city through Census data
The Census of 2011 generated a huge amount of data – around 1.5 billion pieces of information.
Work has already started on making sense of this through data visualisation, and these are starting to be used in secondary Geography classrooms. By focusing on London, this resource provides a context which has national relevance, but is on a more manageable scale. It provides a framework for using Census data and a range of visually stunning maps to support imaginative enquiry work, which will also extend students’ critical thinking as they explore the sprawling city of London.
Students will conclude by taking the role of future urbanists from the 23rd Century, who are looking back at the London of the 21st Century to uncover the factors which lead to its later fate. Students will explore possible, probable and preferable urban futures for the city.
![]() The first 30 minutes guide to Londonmapper (PDF)
The first 30 minutes guide to Londonmapper (PDF)
![]() Londonmapper home page guide (PPT)
Londonmapper home page guide (PPT)
![]() Future urbanists scheme of work PDF | MSWORD
Future urbanists scheme of work PDF | MSWORD
![]() Livability exercise PDF | MSWORD
Livability exercise PDF | MSWORD
![]() Livability activity (PPT)
Livability activity (PPT)
![]() City futures cards (PPT)
City futures cards (PPT)
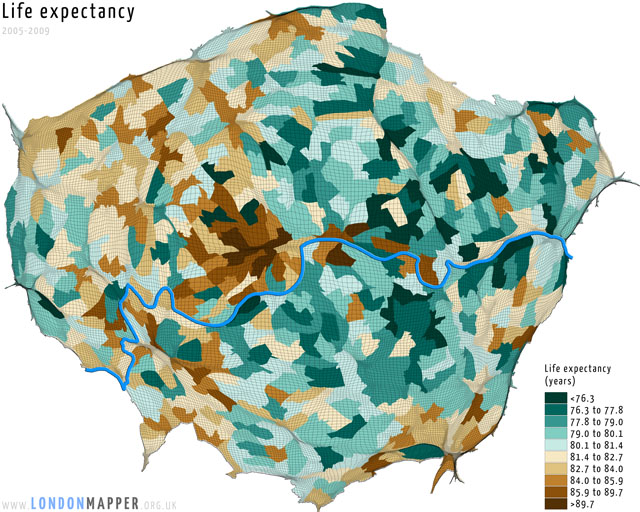
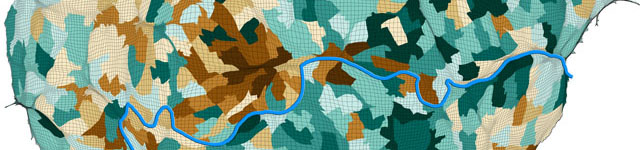
Map showing life expectancy in London 2005-2009
More teaching material
View the KS3 Mapping London unit on the RGS website, also written by Alan Parkinson
 Alan Parkinson worked for the Geographical Association as Secondary Curriculum Development Leader between 2008 and 2011, after teaching for over twenty years in Norfolk and Derbyshire. He developed the popular GeographyPages website in 2001, and received the Ordnance Survey Award for ‘excellence in secondary geography teaching’ from the RGS-IBG in 2008. He is currently a freelance author and geographer as well as a geography teacher.
Follow GeoBlogs’s board Mapping London on Pinterest.
This resource was awarded an Innovative Geography Teaching Grant
from the RGS-IBG in 2014