Grid Children Increase 2002-2012
[colored]Children[/colored]
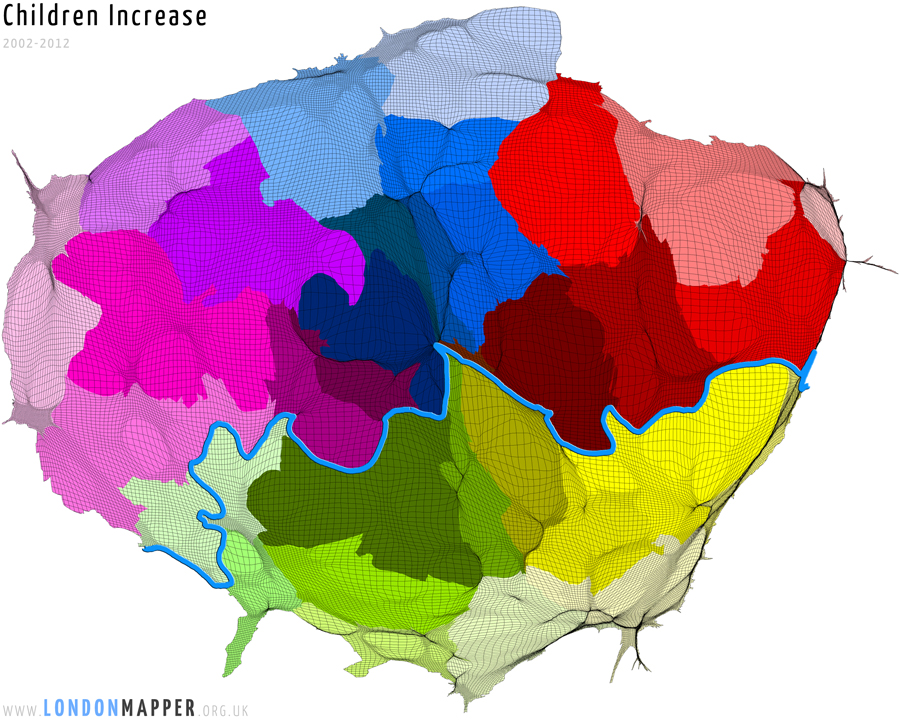
[dropcap1][colored]T[/colored][/dropcap1]his map shows the area of London resized according to the total increase in the number of children aged 0 to 15 in each of the grid cell between the years 2002 to 2012.

[h5]Go To Main Topics[/h5]