Grid Working Age Increase 2002-2012
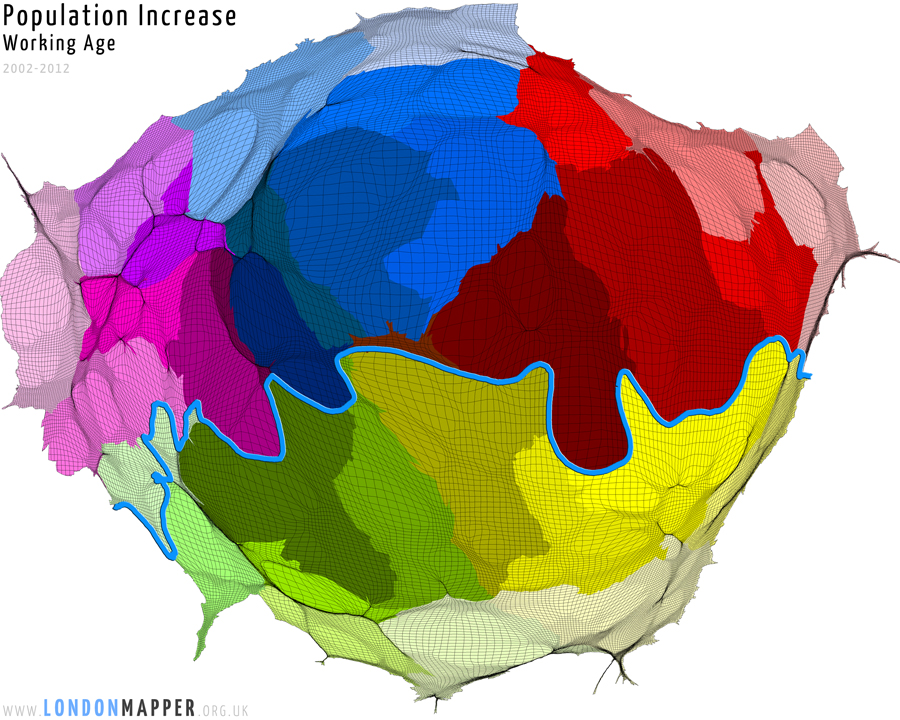
[colored]Working Age Population Increase[/colored]
[dropcap1][colored]T[/colored][/dropcap1]his map shows the area of London resized according to the total increase in the number of working age population in each of the grid cells between the years 2002 to 2012.

[h5]Go To Main Topics[/h5]