England divided
New research shows: England is now more divided than 1980s
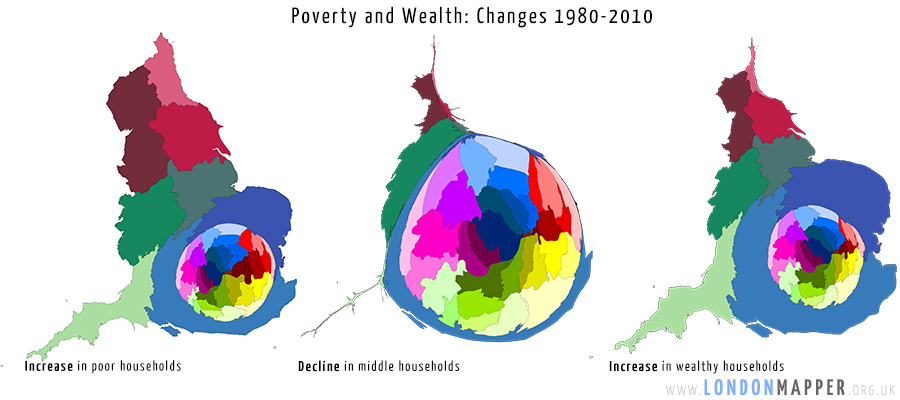
• 60% increase in number of poor households and 33% increase in wealthy households between 1980 and 2010
• Households in the middle are disappearing, with biggest changes in London
New analysis of Census data by the University of Oxford, funded by independent charity Trust for London, shows England has experienced significant changes in the composition of its households during the three decades running from 1980-2010. There has been an increase in the number of poor households, an increase in wealthy households and a squeeze on the middle. The most dramatic changes have been in London with a 43% decrease in the number of households in the middle.
Analysis of the Census by Professor Danny Dorling and Dr Benjamin Hennig, shows that in England from 1980 to 2010 there was a:
• 60% increase in poor households (from 17% to 27%)
• 27% decrease in middle households (from 66% to 48%)
• 33% increase in wealthy households (from 18 to 24%)

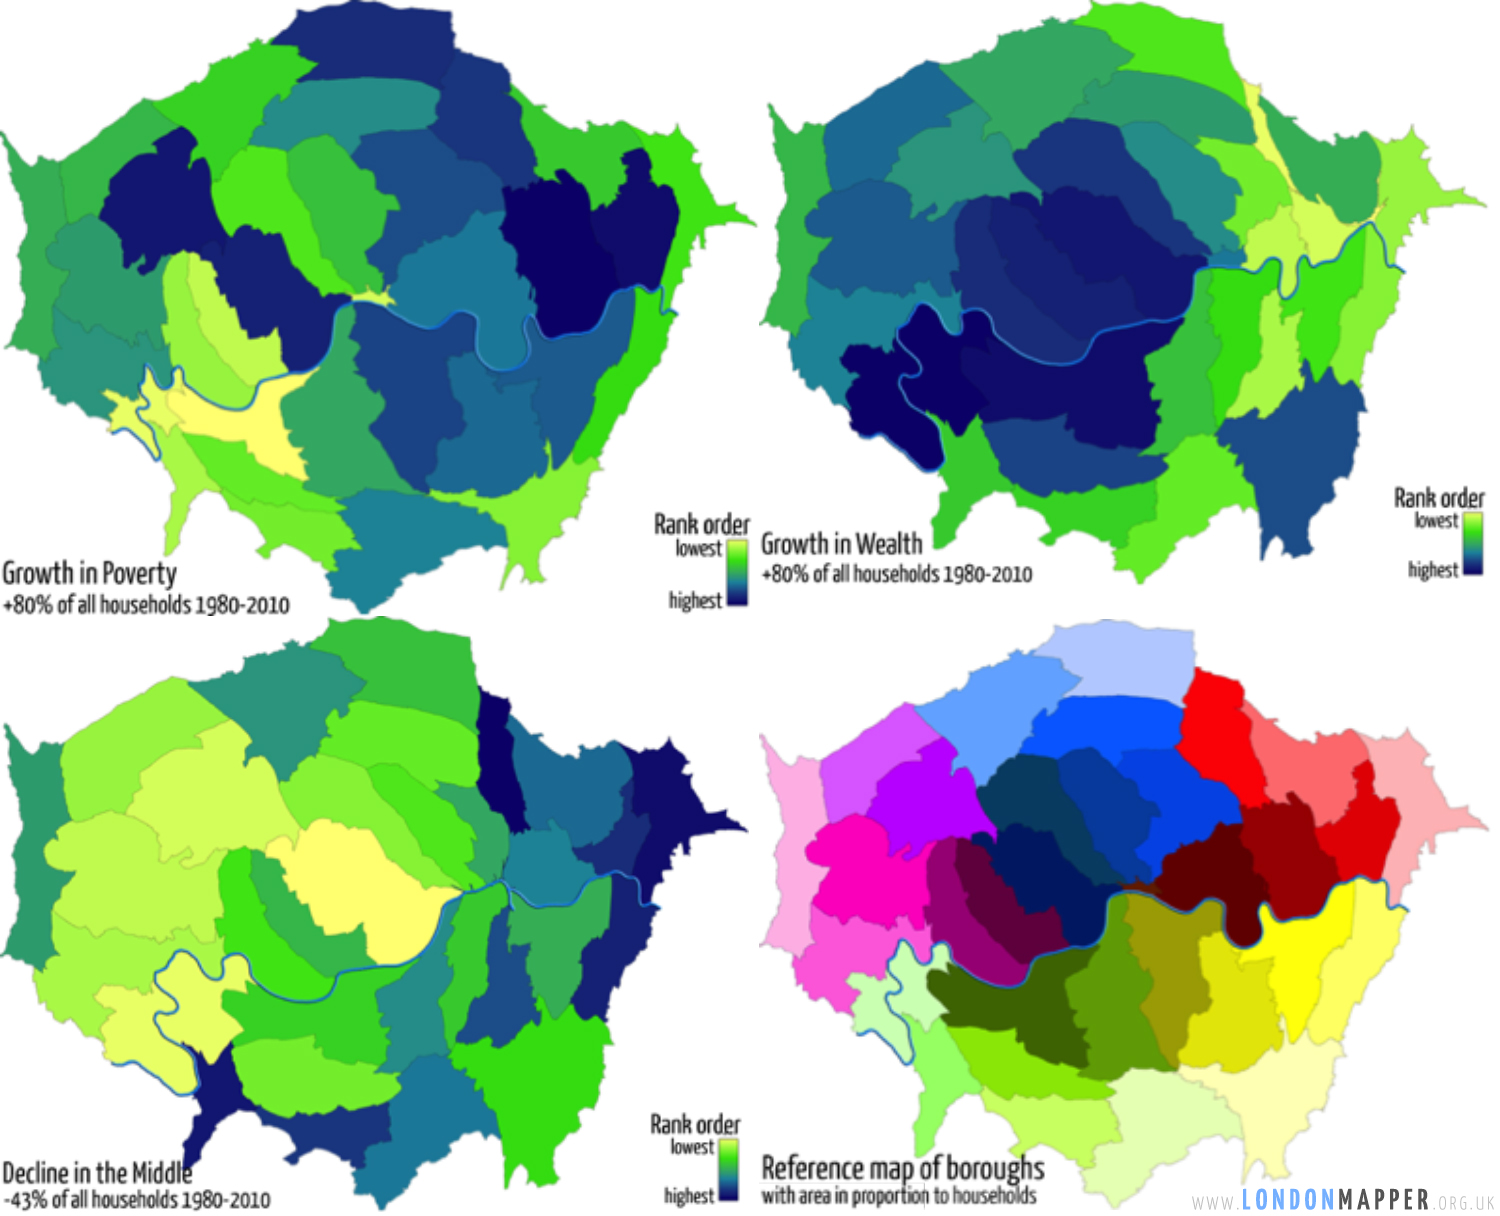
In London from 1980 to 2010 there was a:
• 80% increase in poor households (from 20% to 36%)
• 43% decrease middle households (from 65% to 37%)
• 80% increase in wealthy households (from 15% to 27%)
• A growth in both wealth and of poverty in the centre

By region, households were most likely to be poor in London by 2010 (particularly Inner London where 43% of households are poor). The next highest rate of poverty was found in the North East of England (31%) and the lowest rate was in the South East (22%). In 1980 and 1990 the region with the highest rate of poverty had been the North East.
The changes between London boroughs are also stark. A third of households in Outer London are now rich because they either own their property outright or they have paid off most of their mortgage. Less than a fifth of households in Inner London are rich because so many of them rent and for those who do own a house, they often have huge debts because they have not yet paid off much of their mortgage.
In Inner London from 1980 to 2010 there was a:
• 54% increase in poor households (from 28% to 43%)
• 43% decrease in middle households (from 65% to 37%)
• Over 200% (three-fold) increase in wealthy households (from 6% to 19%)
In Outer London from 1980 to 2010 there was a:
• Over 100% increase in poor households (from 15% to 31%)
• 42% decrease in middle households (from 64% to 37%)
• 65% increase in wealthy households (from 20% to 33%)
The largest percentage point fall in households in the middle has been in Westminster, which saw its middle reduce from nearly three-quarters of all households to just one-third. The largest percentage point increase in wealthy households has been in Richmond, where over half of households are now wealthy, compared to a fifth in 1980. The largest percentage point increase in poverty has been in Newham, where almost 1 out of every 2 households is now poor.
Commenting on the findings Professor Danny Dorling from the University of Oxford said:
“This analysis shows that England is becoming more polarised with an increase in households that are poor and those that are wealthy. The number of households in poverty has jumped by 60% since 1980, meaning that now almost 3 in 10 households are poor.
“At the same time, there has been an increase in the number of wealthy households – 33% in England and 80% in London. This means households in the middle are disappearing, leaving an increasingly divided country and capital. As more households have become poorer, and more people are unable to buy a home or get a mortgage, a small but growing proportion of other households have become very rich.”
Commenting on the findings Mubin Haq, Director of Policy and Grants at independent charity Trust for London, said:
“Whilst there are staggering levels of wealth in London, many are also on the breadline. Too often the headlines are about the capital being the playground for the super-rich, which masks the increasing poverty many face. In 12 of the 33 boroughs in London the poverty rate doubled from 1980 to 2010.
“The net result of the growth in poverty and wealth is a big reduction in households in the middle. This is worrying for those who want a capital city that accommodates all diversities. Often we think about this in relation to ethnicity but income is hugely important especially if we want a city that functions and is fair.
“A significant factor is the cost of housing and our attitudes to property ownership in this country. To reverse these trends we must build more genuinely affordable homes and make it more difficult for the wealthiest to buy up houses solely as an investment opportunity – a safe and affordable home is a basic human need that must be met.”
Further resources
 Interactive map visualisation feature: Poverty and Wealth in London
 Full Analysis including methodology and the underlying data
In the media
 How 30 years of a polarised economy have squeezed out the middle class (Guardian/Observer)
 The Observer view on London’s wealth gap (Guardian/Observer)
Related maps
 Interactive Map Feature: Poverty and Wealth in London
 Middle households 1980: Borough; Borough Rank
 Middle households 1990: Borough; Borough Rank
 Middle households 2000: Borough; Borough Rank
 Middle households 2010: Borough; Borough Rank
 Middle households Change 1980-2010: Borough; Borough Rank
 Poor households 1980: Borough; Borough Rank
 Poor households 1990: Borough; Borough Rank
 Poor households 2000: Borough; Borough Rank
 Poor households 2010: Borough; Borough Rank
 Poor households Change 1980-2010: Borough; Borough Rank
 Wealthy households 1980: Borough; Borough Rank
 Wealthy households 1990: Borough; Borough Rank
 Wealthy households 2000: Borough; Borough Rank
 Wealthy households 2010: Borough; Borough Rank
 Wealthy households Change 1980-2010: Borough; Borough Rank