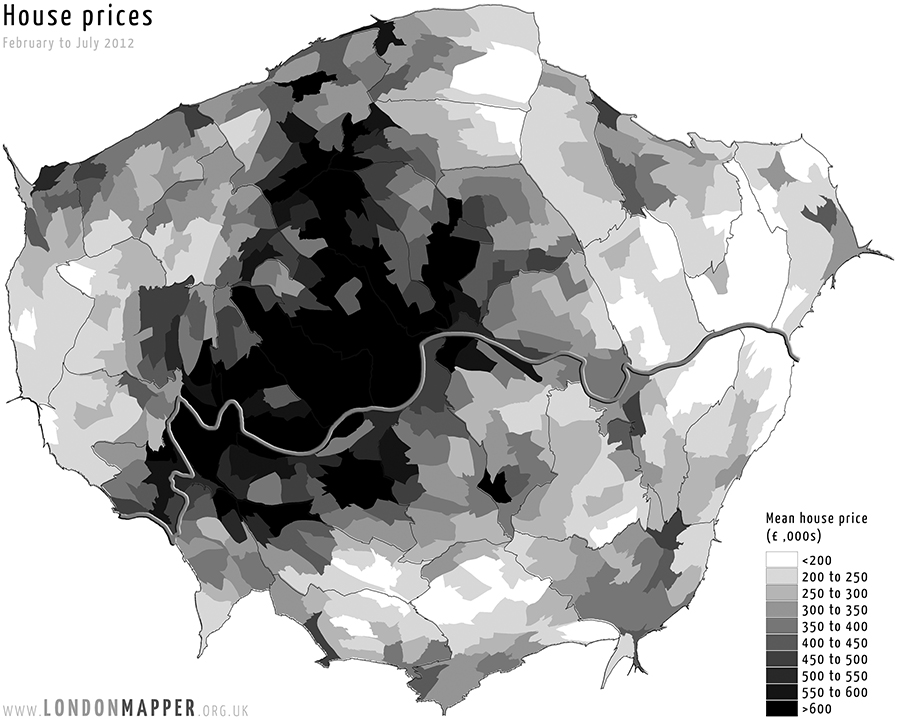
Ward Mean House Price Feb-Jul 2012
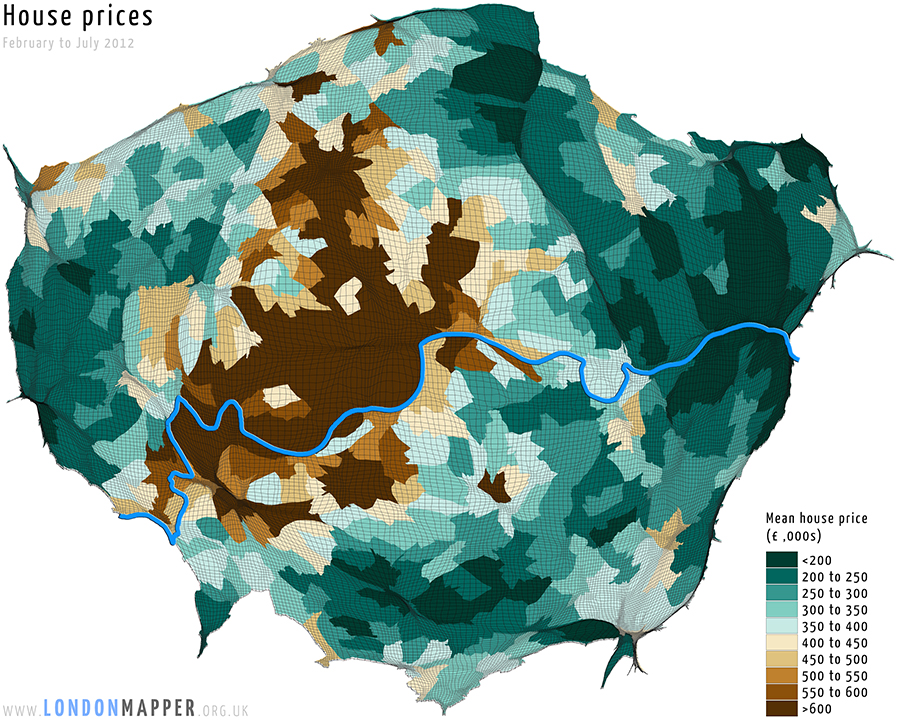
[colored]Mean House Prices[/colored]
[dropcap1][colored]T[/colored][/dropcap1]his map shows the area of London resized according to the total number people living in each of the grid cells as recorded in the 2011 Census. Overlaid on the basemap are the mean house prices in an area for February to July 2012.
See also:
Mean House Prices 2005
Mean House Prices 2006
Mean House Prices 2007
Mean House Prices 2008
Mean House Prices 2009
Mean House Prices Feb-Jul 2012

[h5]Go To Main Topics[/h5]