Grid IMD Income Scale 2010
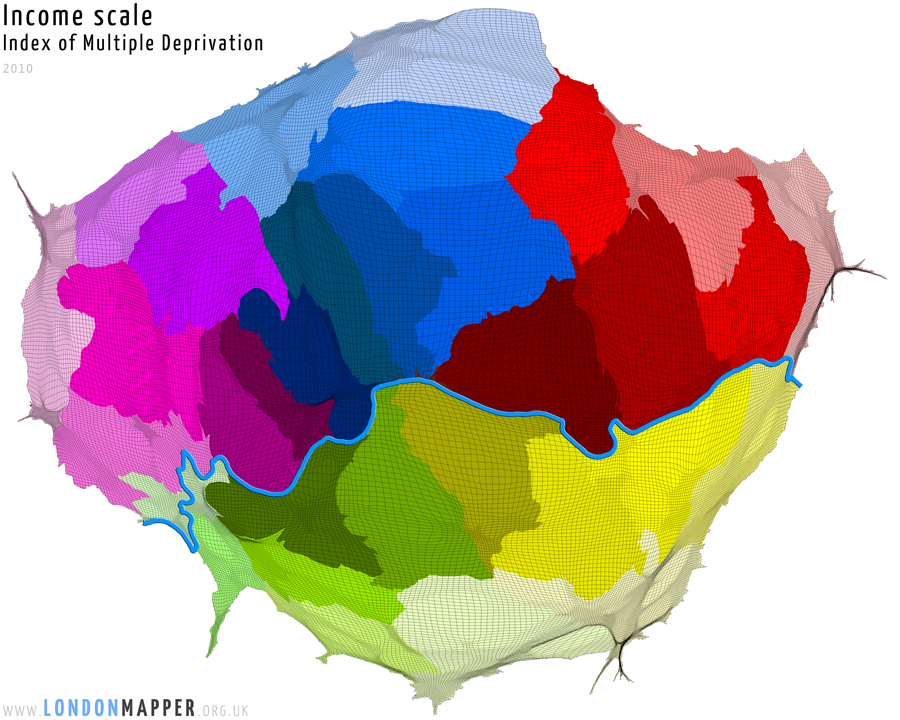
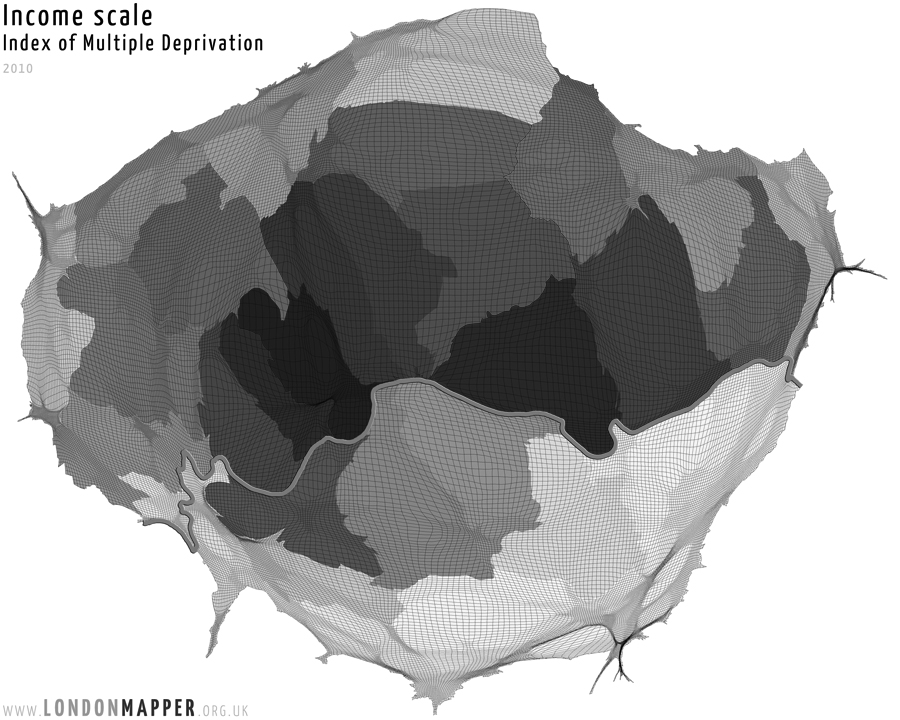
[colored]IMD Income Scale[/colored]
[dropcap1][colored]T[/colored][/dropcap1]his map shows the area of London resized according to the Index of Multiple Deprivation (IMD) income scale score for 2010 multiplied by the population in each of the grid cells shown in the map.
See also:
Grid IMD Income Scale 2007
Grid IMD Income Scale 2010
Grid IMD Income Scale Increase 2007-2010
Grid IMD Income Scale Decline 2007-2010

[h5]Go To Main Topics[/h5]